Precious metals
TDS: Gold Ripe For Short-Covering Rally If U.S. Economic Data Weak
Gold could stage a short-covering rally if economic data should be weak, says TD Securities. The metal has been under pressure since mid-August. “The choppy nature of the current (economic) recovery is likely to prompt the market to adjust its interest rate expectations, which would reduce the discount rates for zero-yielding assets such as gold and may force short covering,” TDS says. Friday’s U.S. nonfarm payrolls report “could be the catalyst that convinces traders that higher interest rates sooner are not a riskless bet.” Many investors have dumped metal from their portfolios on the expectations the U.S.
Swiss Gold Referendum Attracting Attention Two Months Ahead Of Vote
A referendum on Switzerland’s gold reserves is starting to attract some attention outside of the country as a yes vote would have significant implications for the gold market, said one market analyst.
On November 30, Swiss citizens will go to the polls to vote on three areas; whether or not the Swiss National Bank should increase its gold reserves to 20%, that the central bank should stop selling its precious metals and that all its gold should be held within the country….
In a research note published Sept. 24, Analysts at UBS said that if the referendum passes the Swiss National Bank would have to buy about 1,500 tons of gold over the next three years. “1500 tonnes equates to half of the world’s annual production,” they said in the report.
“That kind of gold buying would put what we’ve recently seen in China to shame,” said Hansen.
The UBS analysts also noted that so far the referendum has not attracted a lot of attention outside of the country.
To US Fed – thank you for saving the gamblers in 2008. They should have been jailed.
We are told there is no bubble, except in gold, of course. Who would want the barbaric relic?
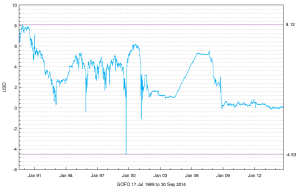
Since 2009 gold price was determined by the gold/dollar swap rate, which fluctuated between plus or minus 0.1%. When this rate was negative 0.1%, meaning that gold yielded 0.1% (per year) more than USD, gold rallied $100. When it was positive, gold tanked $100. Isn’t it amazing that the difference in Yield of a mere 0.1% causes $100, $200 move in price? Isn’t it great to actually be one of the setters of gold interest rates in London? Think about it!
Manipulation of Libor has been the scandal of the recent years. Why not Gofo? But of course!
Kitco Gold survey – a great contrarian indicator.
Kitco gold survey has been a great indicator… in reverse. So, this week’s survey is forecasting a strong advance for gold prices in the week ahead.

A majority of participants forecast lower gold prices next week in the Kitco News Gold Survey as dollar strength and bearish technical-chart formations weigh on the metal.
Out of 37 participants, 20 responded this week. Of those, four see higher prices, 12 see lower prices and four see prices trading sideways or are neutral. Market participants include bullion dealers, investment banks, futures traders and technical-chart analysts.
Last week, survey participants were bearish. As of 11:30 a.m. EDT, Comex December gold was down about 50 cents for the week.
Those who see weaker prices said there’s little incentive to buy gold in the short-term, with a test of $1,200 an ounce possible.
“It’s got a bit of a negative profile here,” said Charlie Nedoss, senior market strategist at LaSalle Futures Group. “The dollar is weighing on it. It’s still under the 10-day (moving average), which is about $1,224.80 (basis the December futures). It’s ridden that all the way down. I can’t really start to get excited until it can get over that. And the 20-day is at $1240.21.”
More here
Time for Great Depression has arrived
With the decision of “Operation Twist” by US Federal Reserve to rotate 400 billion dollars
from short maturity T-bills to longer maturities and no new printing, the economic recovery
can no longer be sustained. The Keynesian policymakers are out of bullets as we descend
into post credit bubble economic depression. Operation twist was not what the market
anticipated, the market anticipated QE3. Without further printing or stimulus we anticipate very
rough waters ahead for the economy and the markets. The economic indicators point that a
second recessionhas already started.
I expect that even gold could be vulnerable to a further correction, although, compared to other
indexes it should be mild.
September 2011 Fed Meeting Statement
To support a stronger economic recovery and to help ensure that inflation, over
time, is at levels consistent with the dual mandate, the Committee decided today to extend the
average maturity of its holdings of securities. The Committee intends to purchase, by the end of
June 2012, $400 billion of Treasury securities with remaining maturities of 6 years to 30 years
and to sell an equal amount of Treasury securities with remaining maturities of 3 years or less.
This program should put downward pressure on longer-term interest rates and help make
broader financial conditions more accommodative. The Committee will regularly review the size
and composition of its securities holdings and is prepared to adjust those holdings as
appropriate.
Precious metals: buy this dip
As stated here, the precious metals market usually experiences a healthy correction
from mid-October until mid-November due to the end of Indian festival Jewelry demand.
The seasonal bull move ends in February. Add to that excellent fundamentals for the precious metals as US Federal Reserve is
contemplating another major devaluation of US dollar (Quantitative Easing 2).
There is only one action – buy this dip!
Gold seasonals and technicals
Many now argue gold is in a bubble. Indeed, in recent years demand for gold
as an asset went sharply higher. However, if history is an indication, more likely
than not this will result in enormous gains in the years ahead. Gold is going up
for fundamental reasons, Quantitative Easing (money printing) around the world
and in the US in particular.
Jesse repeatedly argued for bullish cup and handle
formation in the gold market, which is not broken while gold stays above 1160.
The pattern has a target of 1375, which will most likely be reached during the bullish
gold season, August through February.
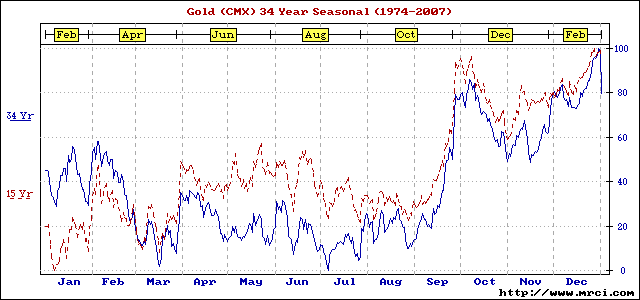
The seasonal chart for gold is below, from 321gold.
Typically gold bottoms in July, goes mildly higher in August, then takes off in September.
The situation was different in 2008, but that, perhaps, happened due to a sharp rally of the dollar.
Gold reached a new all time high in many major currencies in late 2008.
John Embry of Sprott Asset Management on Fed’s options.
Essentially, the two choices for the Fed are not pretty –
hyperinflate or face a devastating deflationary collapse due
to mega-Ponzi derivative fiasco. The Fed chose hyperinflation.
“Any serious attempt to withdraw the stimulus at
this point will trigger a deflationary depression and
a continuation of the current policies will put us
firmly on the road to hyperinflation”
Inflation, Deflation, or a pure mess.
Do we have to worry about gold?
In my view, just buy physical gold and silver, GDX and GDXJ, and keep them. Gold
will go up. How much depends on policy actions. In particular, whether or not the
US government chooses to pursue very accomodative fiscal and monetary policy.
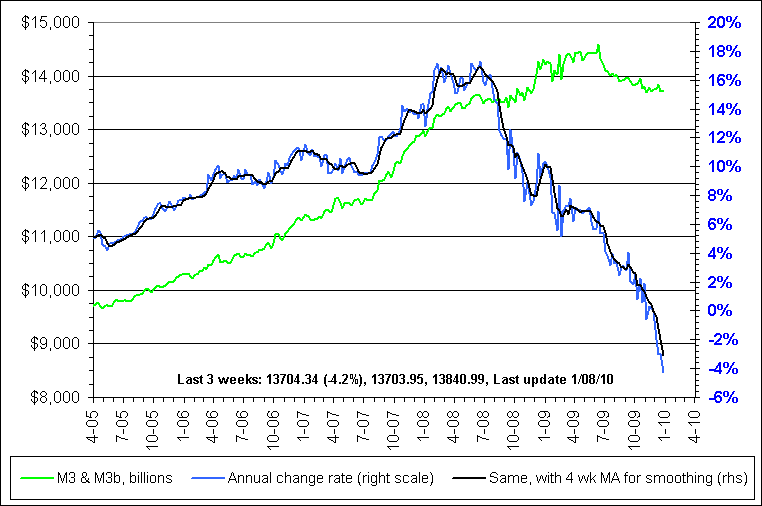
On the charts front, reconstructed M3 from Bart at nowandfutures.com and John
Williams at shadowstats.com shows a decline. However, inflation is picking up,
and the Fed printing so far is going ballistic.
The Fed emits tightening noises, but, given US employment situation, rates will
stay at Zero for a long time. The printing program will end in March, while the
government mortgage subsidy program ends in April. Then we will see how the economy
performs without direct money printing support, or what the Fed will do if it falters
again. This could be expected, since an enormous credit bubble popped in 2006-2008.
Charts of gold mania: Do equities always lead?
It seems to be a common assumption among precious metals investors that
the equities (GDX, HUI, GDXJ, XAU) always lead gold price. These charts
of the previous mania illustrate that this assumption is not always correct.
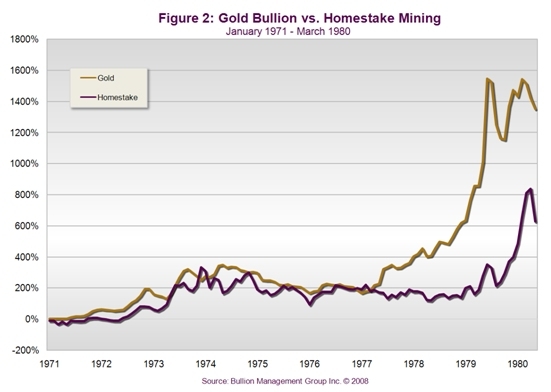
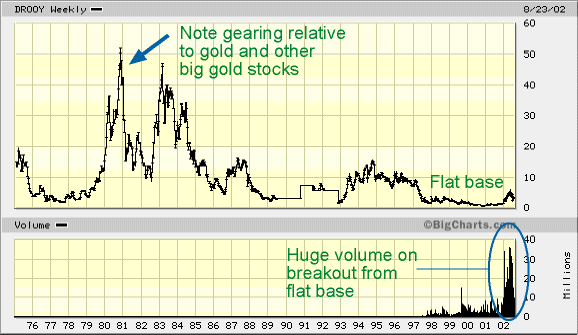
You can see below that the stock of Homestake mining and DRD gold did not take off
until the gold mania went into overdrive in 1979-1980. In early 1979 Drooy was
actually DOWN as much as 80% from 1975. The equities did catch up with the metal
in 1979, and then some.
