Archive for May, 2010
Economic depression in various countries
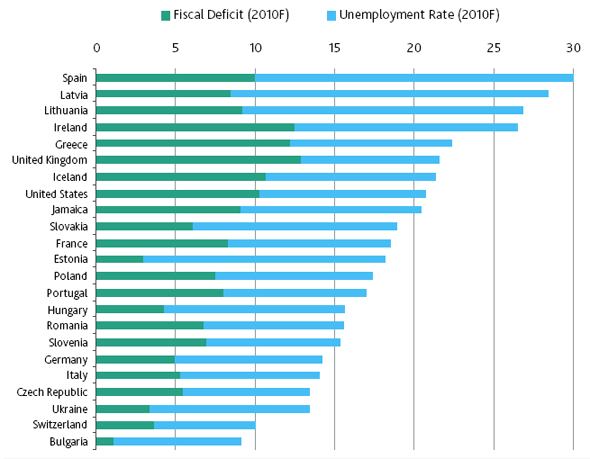
This chart illustrates how bad things are around the globe following financial
crisis. US and UK, while not downgraded yet, are close to the top of the list.

Unemployment and budget deficit in various countries
Stocks and dollar update
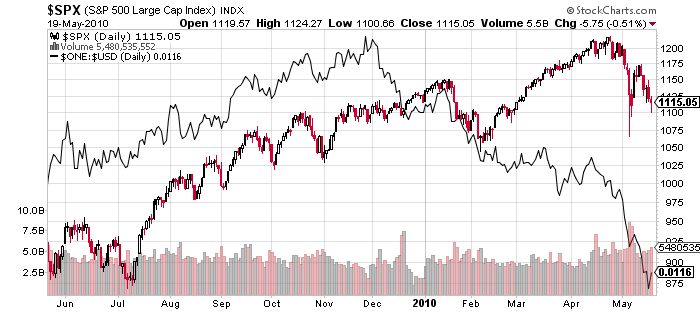
A huge disconnect developed between SP500 index and the dollar since December
2009, when this was posted. Be careful out there. The tentative
level for SP500 at which USD reconnects with it is 775.

Stocks vs 1/USD
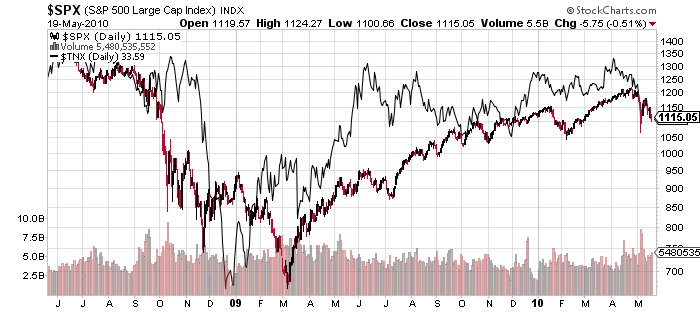
Below is a chart of 10-year interest rates (TNX) vs SP500. As you can see, the
disconnect developed as a result of October 2008 crash. The two later re-connected.
Shortly after October 2008 crash there was a major opportunity to be long T-bonds.

SP500 vs 10-year T-bond interest rate
Two choices: devalue or default
John Hussman clarifies that the European bailout last week was a loan,
not a printing effort. It will be sterilized. This could have direct implications for the
global stock market, as it may continue to head lower. Stay tuned this week,
as technically a follow through to the downside is crucial for the bear case.
We could also be at risk of yet another “flash crash” due to the lack of liquidity
in the global financial system.
Two Choices: Restructure Debts or Debase Currencies
John P. Hussman, Ph.D.
Last week, the European Central Bank pledged to spend as much as 750 billion euros (about a trillion US dollars) in an attempt
to discourage market concerns about European debt, particularly that of Greece, Portugal and Spain. The intended message
was to show the markets – particularly bond market “vigilantes” speculating against European debt – that the ECB has deep
enough pockets to thwart the mounting pressure on European debt and the euro itself.ECB President Jean-Claude Trichet has been quick to deny concerns that the move by the ECB will be inflationary, emphasizing
that the intervention will be “sterilized” in order to prevent a major increase in the amount of euros outstanding. This is “totally
different,” he argued last week, from the massive increase in monetary base that has occurred as the U.S. Federal Reserve has
bought up over $1.25 trillion in debt obligations of Fannie Mae and Freddie Mac. A “sterilized intervention” is one where the
euros created through the purchase of distressed Euro-area debt will also be absorbed by selling other assets from the ECB’s
balance sheet, in order to take those euros back in.In order to evaluate the arguments being made, it’s helpful to understand the balance sheet of a typical central bank. Whether
in the U.S., Europe, or elsewhere, the basic structure is the same. On the asset side, the central bank has government debt
that it has purchased over time. A small proportion of total assets might be held in “hard” assets such as gold, but primarily,
the assets of each central bank has traditionally represented government debt – mostly of its own nation (or in the case of the
ECB, euro-area governments). As a central bank purchases these securities, it creates an equal amount of liabilities, in the
form of “monetary base” (currency and bank reserves).Notice, for example, that the pieces of paper in your wallet have the words “Federal Reserve Note” inscribed at the top.
Currency is a liability of the Federal Reserve, against which it has traditionally held assets such as Treasury securities, and prior
to 1971, at least fractional backing in gold.In this context, consider the ECB’s proposed 750 billion euro line of defense. Essentially the ECB is saying “We stand ready to
buy as much as 750 billion euros of distressed Euro-area debt in order to defend the euro.” Simultaneously, despite the fact
that Euro area countries are running large fiscal deficits, the worst being in Greece, Portugal and Spain, the ECB is saying
“However, we intend to sterilize this intervention, which will ultimately require that we sell Euro-area debt into the market in
order to absorb the euros we create.” The only way that both statements can be true is for the ECB to admit “Therefore, we
are fundamentally promising to debase the quality of our balance sheet, by exchanging higher quality Euro-area debt with
lower-quality debt of countries that are ultimately likely to default.”Far from being “totally different” from what the U.S. Federal Reserve has done, the ECB is essentially promising exactly the
same thing – to corrupt its balance sheet and debase its currency in order to protect the worst stewards of capital from the
consequences of bad lending and poor investment.……………………………………………………………………………………………
Did Computers Cause the May 6 Stock Market Crash?
Yes, computers were blamed for May, 6 market meltdown
Here is some fun video from Josh Lipton on Minyanville on this subject.
Take a look, it is hillarious!
Citigroup says UK might blow up.
We have warned in recent months of upside risks to UK inflation, plus the risk
that the election will produce a hung parliament which is unable to quickly
establish a credible path back to fiscal sustainability. These worries have not
been calmed by the Budget and latest inflation data. Gilts and sterling remain
vulnerable, and the MPC may feel compelled to hike rather earlier than
markets project to cap inflation expectations.Budget Fails to Establish Path Back to Fiscal Sustainability
The Budget acknowledged that this year’s deficit will undershoot the PBR
plans by about £11bn, largely because of a revenue rebound, but failed to
tackle the UK’s medium-term fiscal outlook, which is the key issue.
The government’s fiscal forecasts remain relatively unambitious compared to
other high deficit countries. The Budget projected that the fiscal deficit will fall
to 4-4.5% of GDP in 2014/15, whereas other high deficit EU countries expect
to get their deficits to 3% of GDP or less over that timeframe (and generally
before 2014). As a result, the UK government continues to forecast a more
extended rise in the public debt/GDP ratio than other EU countries, with the
debt/GDP ratio not peaking until 2013/14 – a year later than Portugal,
Ireland and Spain, two years later than Greece and three years later than Italy.Moreover, the UK lacks credible plans to achieve even that relatively
unambitious fiscal path. The government’s fiscal forecasts rely chiefly on a
plunge in the public spending/GDP ratio from 48% in 10/11 to 42.5% in 14/15.
But, these are just forecasts. There are no plans for either total public
spending or for spending by individual government departments beyond the
10/11 fiscal year. Without these, the fiscal forecasts lack credibility.
See the full report here.
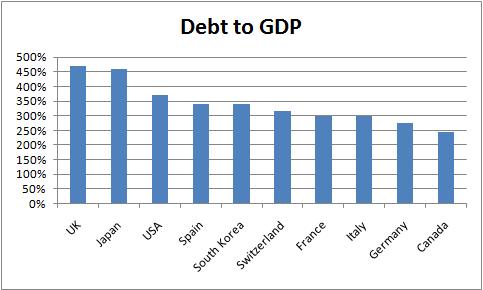
Global debt to GDP ratio
This picture is worth 1000 words. While Sovereign issues in Europe have become
an immediate concern for the global markets, the big offenders are the G7 countries!
The UK, Japan, and the US are at the top of the list.
If the total debt load becomes a concern for the markets, I would expect very
difficult financial conditions.

G7 debt to GDP ratio
How To Play The Coming Dollar Crash
Are funding problems in US housing bubble States such as California, Florida or
Nevada that much different from the problems in Southern Europe? Not
really. However, Sovereign bond ratings are assigned by US credit rating agencies,
which will be reluctant to downgrade US. The crash of the Euro due to PIIGS (Portugal,
Italy, Ireland, Greece, and Spain) blowing up appears to be overdone. Time for
a reversal soon?
Here is the EURUSD COT position
How To Play The Coming Dollar Crash
Curtis Hesler, Professional Timing Service, 04.06.10, 07:10 PM EDT
Last December I headlined my monthly newsletter “How To Play The Dollar Rally.” The short version is that the same technical indicators that were bullish at the end of last year are beginning to transmit bearish omens. There is likely a bit more on the upside for the dollar before it turns, but this final phase of the rally will press precious metals and crude back. It will provide us with a final buying opportunity before the next leg in the commodity bull unfolds.
Here is what is developing. First is sentiment. Everyone on The Street was bearish and was selling the dollar at its late 2009 lows, but there is nothing like a good rally to bring out the bulls. I guess folks just like to buy high and sell low.
There are, of course, those dyed-in-the-wool dollar bears who refuse to recognize the cyclical aspects of the markets. Nevertheless, I am currently seeing more articles espousing a dollar recovery than talk about a return to new lows.
A good number of the dollar bulls are basing their stand on the weakness in the euro. There is some truth to this argument. The euro has been pushed from over 1.50 in early December to about 1.32 lately, and there should be good support at 1.25-1.30.
If you look at the Moving Average Convergence/Divergence (MACD) and Relative Strength Index (RSI) patterns on a chart of the CurrencyShares Euro Trust ( FXE – news – people ) you’ll note that neither the MACD nor the RSI are making new lows with the FXE. MACD is about to produce a second buy signal replete with positive divergence. The positive divergence in the RSI since it bottomed out in February is also telling us to start looking for the end of this decline in the euro.
The euro is setting up for at least a short-term trading rally. I believe fundamentals will support this. Germany is going to orchestrate assistance for Greece without getting personally committed. The Germans will use the crisis to augment their position of power in Europe — something they have not had for many years. Things will appear better in “euroland” soon, and that will give the euro support. As it finds support, dollar traders will begin selling.
The technical omens are present in the dollar also. It is not surprising that the MACD and RSI patterns that we see in the U.S. Dollar Index are the mirror image of those in the FXE chart. Beyond that, the Commodity Channel Index on the weekly dollar is hovering at +100.00, and a break below that will produce a major sell signal. Bottom line, the dollar rally looks like it has a little more life left in it, but not much. It may even venture toward 83.50, but my indicators are telling us to be ready to use a last ditch dollar bounce to our advantage.
The best way to play the next turn in the dollar is to use the last phase of the dollar rally to build positions in precious metals. You need to do this now before the dollar’s top is in. We have a little time, but not much. I expect that the dollar will find its final rally high by the end of this month.
As the precious metals markets pull back in response to a stronger dollar, we will see some magnificent buying opportunities in individual mining shares. I have reviewed the downside buy prices; and by and large, they are where they should be.
See more recommendations and the full article here.
………..
Soros: Tame Derivatives or Risk Yet Another Crash
Billionaire George Soros says the derivatives behind the Securities and Exchange
Commissions’ case against Goldman Sachs “merely cloned existing mortgage-backed
securities into imaginary units that mimicked the originals.”
“Whether or not Goldman is guilty, the transaction in question clearly had no social
benefit,” Soros writes in the Financial Times. “The primary purpose of the transaction
was to generate fees and commissions.
“This synthetic collateralized debt obligation did not finance the ownership of any
additional homes or allocate capital more efficiently; it merely swelled the volume of
mortgage-backed securities that lost value when the housing bubble burst.”
Requiring derivatives and synthetic securities to be registered would be simple and
effective, Soros says, but the legislation currently under consideration won’t
accomplish it.
Derivatives traded on exchanges should be registered as a class, Soros says. Tailor-
made derivatives would have to be registered individually, with regulators obliged to
understand the risks involved.
“Registration is laborious and time-consuming, and would discourage the use of over-
the-counter derivatives,” Soros notes. “Tailor-made products could be put together
from exchange-traded instruments,” he says.
“This would prevent a recurrence of the abuses which contributed to the 2008 crash.”
…………………………
Meltup
This video from inflation.us explains the problems US is currently facing. Is this
the beginning of US currency crisis or hyperinflation? The video is rather long,
but it is a must watch.
Flash crash on Wall Street
This article from the Huffington post blames Thursday sudden
market crash on Wall Street on High Frequency Traders. It is a must read.
Secretive Speed Traders In Spotlight After Flash Crash On Wall Street
BERNARD CONDON | 05/15/10 12:31 PM |
NEW YORK — If you saw a penny on the sidewalk, would you pick it up?
You may think it’s not worth the effort, but a breed of investors who have been in the news do. Using super-fast computers, high-frequency traders in effect bend down to pick up pennies lying about in the stock market – then do it again, sometimes thousands of times a second.
More than a week after the Dow Jones industrial average fell nearly 1,000 points, its biggest intraday drop ever, regulators are still sifting through buy and sell orders to figure out what sparked it. One big focus are orders placed by high-frequency traders, or HFTs, and for good reason. These quick-buck firms barely existed a few years ago but now account for two-thirds of all U.S. stock trading.
In other words, all those TV pictures of the stately New York Stock Exchange building on the evening news are an illusion. The real action on Wall Street is far away in Kansas City, Mo., and in New Jersey, in towns like Carteret and Red Bank, where HFTs named Tradebot and Wolverine and Tradeworx ply their trade.
High-frequency trading firms, which number over 100, use computers programmed with complex mathematical formulas to comb markets for securities priced too high or too low because traders haven’t had to time to react to the latest data. The computers then buy or sell in a split second, locking in a profit.
…………………………….

